
Match your forecast with your plan, bayesian style
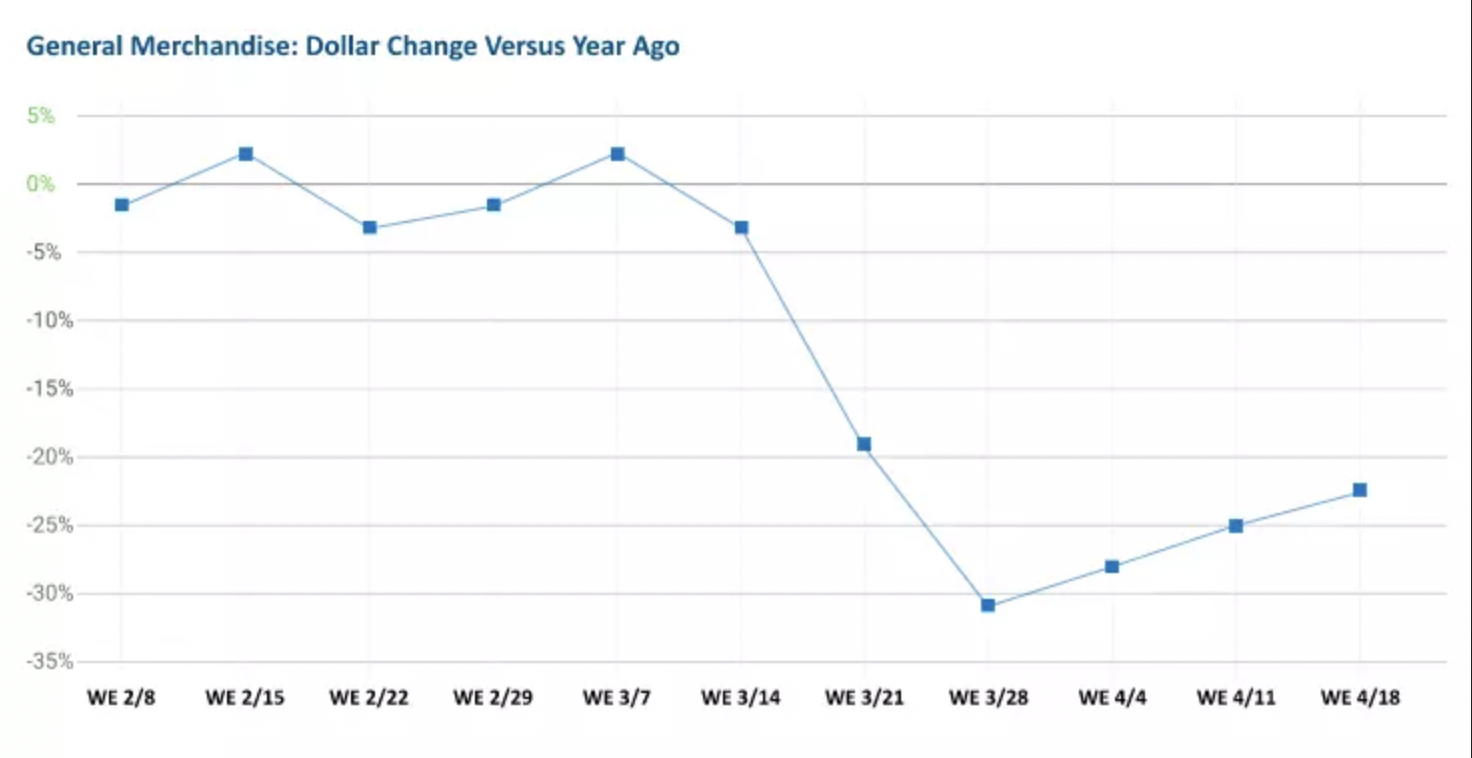
The COVID pandemic is inching to an end, but its effects on global economics is still a painful ache. Retailers across the globe (checkmate flat earther!) are having a seizure looking at their drop dead sale timeseries. Something looking like this:

Okay may be not like that, but more like this:
At one retailer named Everything On Sale, there goes the conversation:
Alice: Now the problem for us the retailer is that how do we adjust the financial outlook to this new timeline, and how do we adjust our inventory outlook to match the amount of money we have ?
Bob: Cut every product down, say, 60% of units ?
Alice: Good point, but how do we handle the products with only 1 unit in the forecast (Or anything is not an integer, for that matter) ?
Bob: Okay we have plenty of skus, let’s drop some and keep some.
Alice: Clever, we can choose which one to keep based on their sale number. Let’s keep the one with the higher sale!
Bob: Perfect! But the question still remains: how do we make it match the plan of selling 234 units, coming from Chad at finance ?
Alice: How about giving each product an equal fraction of the total sale ?
Bob: Does not work, our sales don’t look like that. See, diapers sell a lot more units than Mama Recreational Massage Device! We will end up with an empty stock of diapers and a lot of unsold MRMD…
And then gospel music plays, descending Deacon, a fanatic from the church of Bayesian, across the street. Deacon said:
Hear me children! You can randomly sample units, based on the sale ratio of each product.
The prophecy struct their ears. Bob and Alice exploded. They are in awe, asking Deacon for the sauce.
Deacon draws on the board the mathematical squiggles, dazzles Alice and Bob. The board is full of drawings like worms on sand (integrals and such), characters that do not constitute any word, very strange to Bob and Alice. However, they still believe.
The church of Bayesian, unlike other churches, has their beliefs in working order with their theories. That’s why it’s spreading faster than Toronto sewage steam on a cold day.

Vincent, as a practical Bayesian bible reader, translates the squiggles into Bob and Alice language of the big squiggling animal (Python). And then he took Bob and Alice out to lunch and then more about his prior belief.
End of story!
Okay, here are more technical details of the method. Let’s say that we have an assortment of N products. Each with a certain forecast of sales next month. The problem is how do we take those forecasts and adjust it to match an exact grand total number.
The question now is: How we do allocate this amount of sales to each of our product ?
We can do this by resample the sale, taking in normalized sales as sampling probabilities. This can be modeled as a Categorical distribution probabilities. We will draw random samples from this distribution until we reach our total goal.
Anecdote: The distribution could have any shape. Many time we see sales usually concentrated in a small number of products, and little distributed to others. But your shape of distribution may vary. The algorithm works the same.
The theoretical data generating process as background for this method is as follows:
-
We assume sales across the assortment is a Dirichlet distribution D(V), where V is a vector of size N, each element of V is the number of sales for each product. Generally, Dirichlet prior used a vector of ones as a weak prior. We can choose an even weaker prior like a vector of 1/2 (Jeffrey) or zeros (Haldane prior).
-
The likelihood is a Categorical distribution
-
The posterior is a Dirichlet D(V’) , as a consequence of conjugation with the Categorical likelihood. The elements in vector V’ is now the sale of each product after scaling.
I’ve tested this method against others like in the goofy conversation above. Evidence so far shows that it produces a new distribution closest to the original, based on Kullback-Leibner divergence. However, I don’t have any formal proof for it yet. The theoretical question is still: How do we find a distribution of sale that is the most similar to another, subject to a constraint. In this case, the constraint is that the total sale has to match a certain number.
The choice of priors for the Dirichlet is quite interesting. In practice, many products have zero for its original distribution (the forecast). And by that, it will not be resampled by the method. Adding 1 to each number (of the forecast, or the vector V) gives it a little chance to show up in the sampling process. This is equal to the Uniform prior, or Dirichlet (1).