Modelling changes in timeseries with sigmoids, a noodle study
In this post I introduce a probabilistic model to detect a surge in time series data, using sigmoid functions.
Classical framework for detecting changes
Let’s say that you are tracking a stable metric of your product and just roll out a killer feature. You would want to know how much it affects your metrics over time. Most of the time, you can A/B test your metrics.
But A/B testing assumes that the underlying metric stays flat over time. Which means when your metric is slowly changing over time, say, a linear trend, then performing an A/B test on this is likely to make you miss interpret your result.
In cases like this, you would want to perform a regression of some kind, controlling for time (It should be pointed out that in cases like this, time is a proxy variable to the true variable that you want to control for, but it’s okay).
In the classical framework, we have a tool called diff-in-diff. In short, you throw in a binary variable indicating your changing variable and when it changes.
Diff-in-diff is also not able to detect gradual changes over time, but a sudden jump only.
Detecting gradual changes with sigmoid functions
Sigmoids are fun. They are smooth, and have nice analytical gradients, as they come from the exponential family. People usually use them for classification.
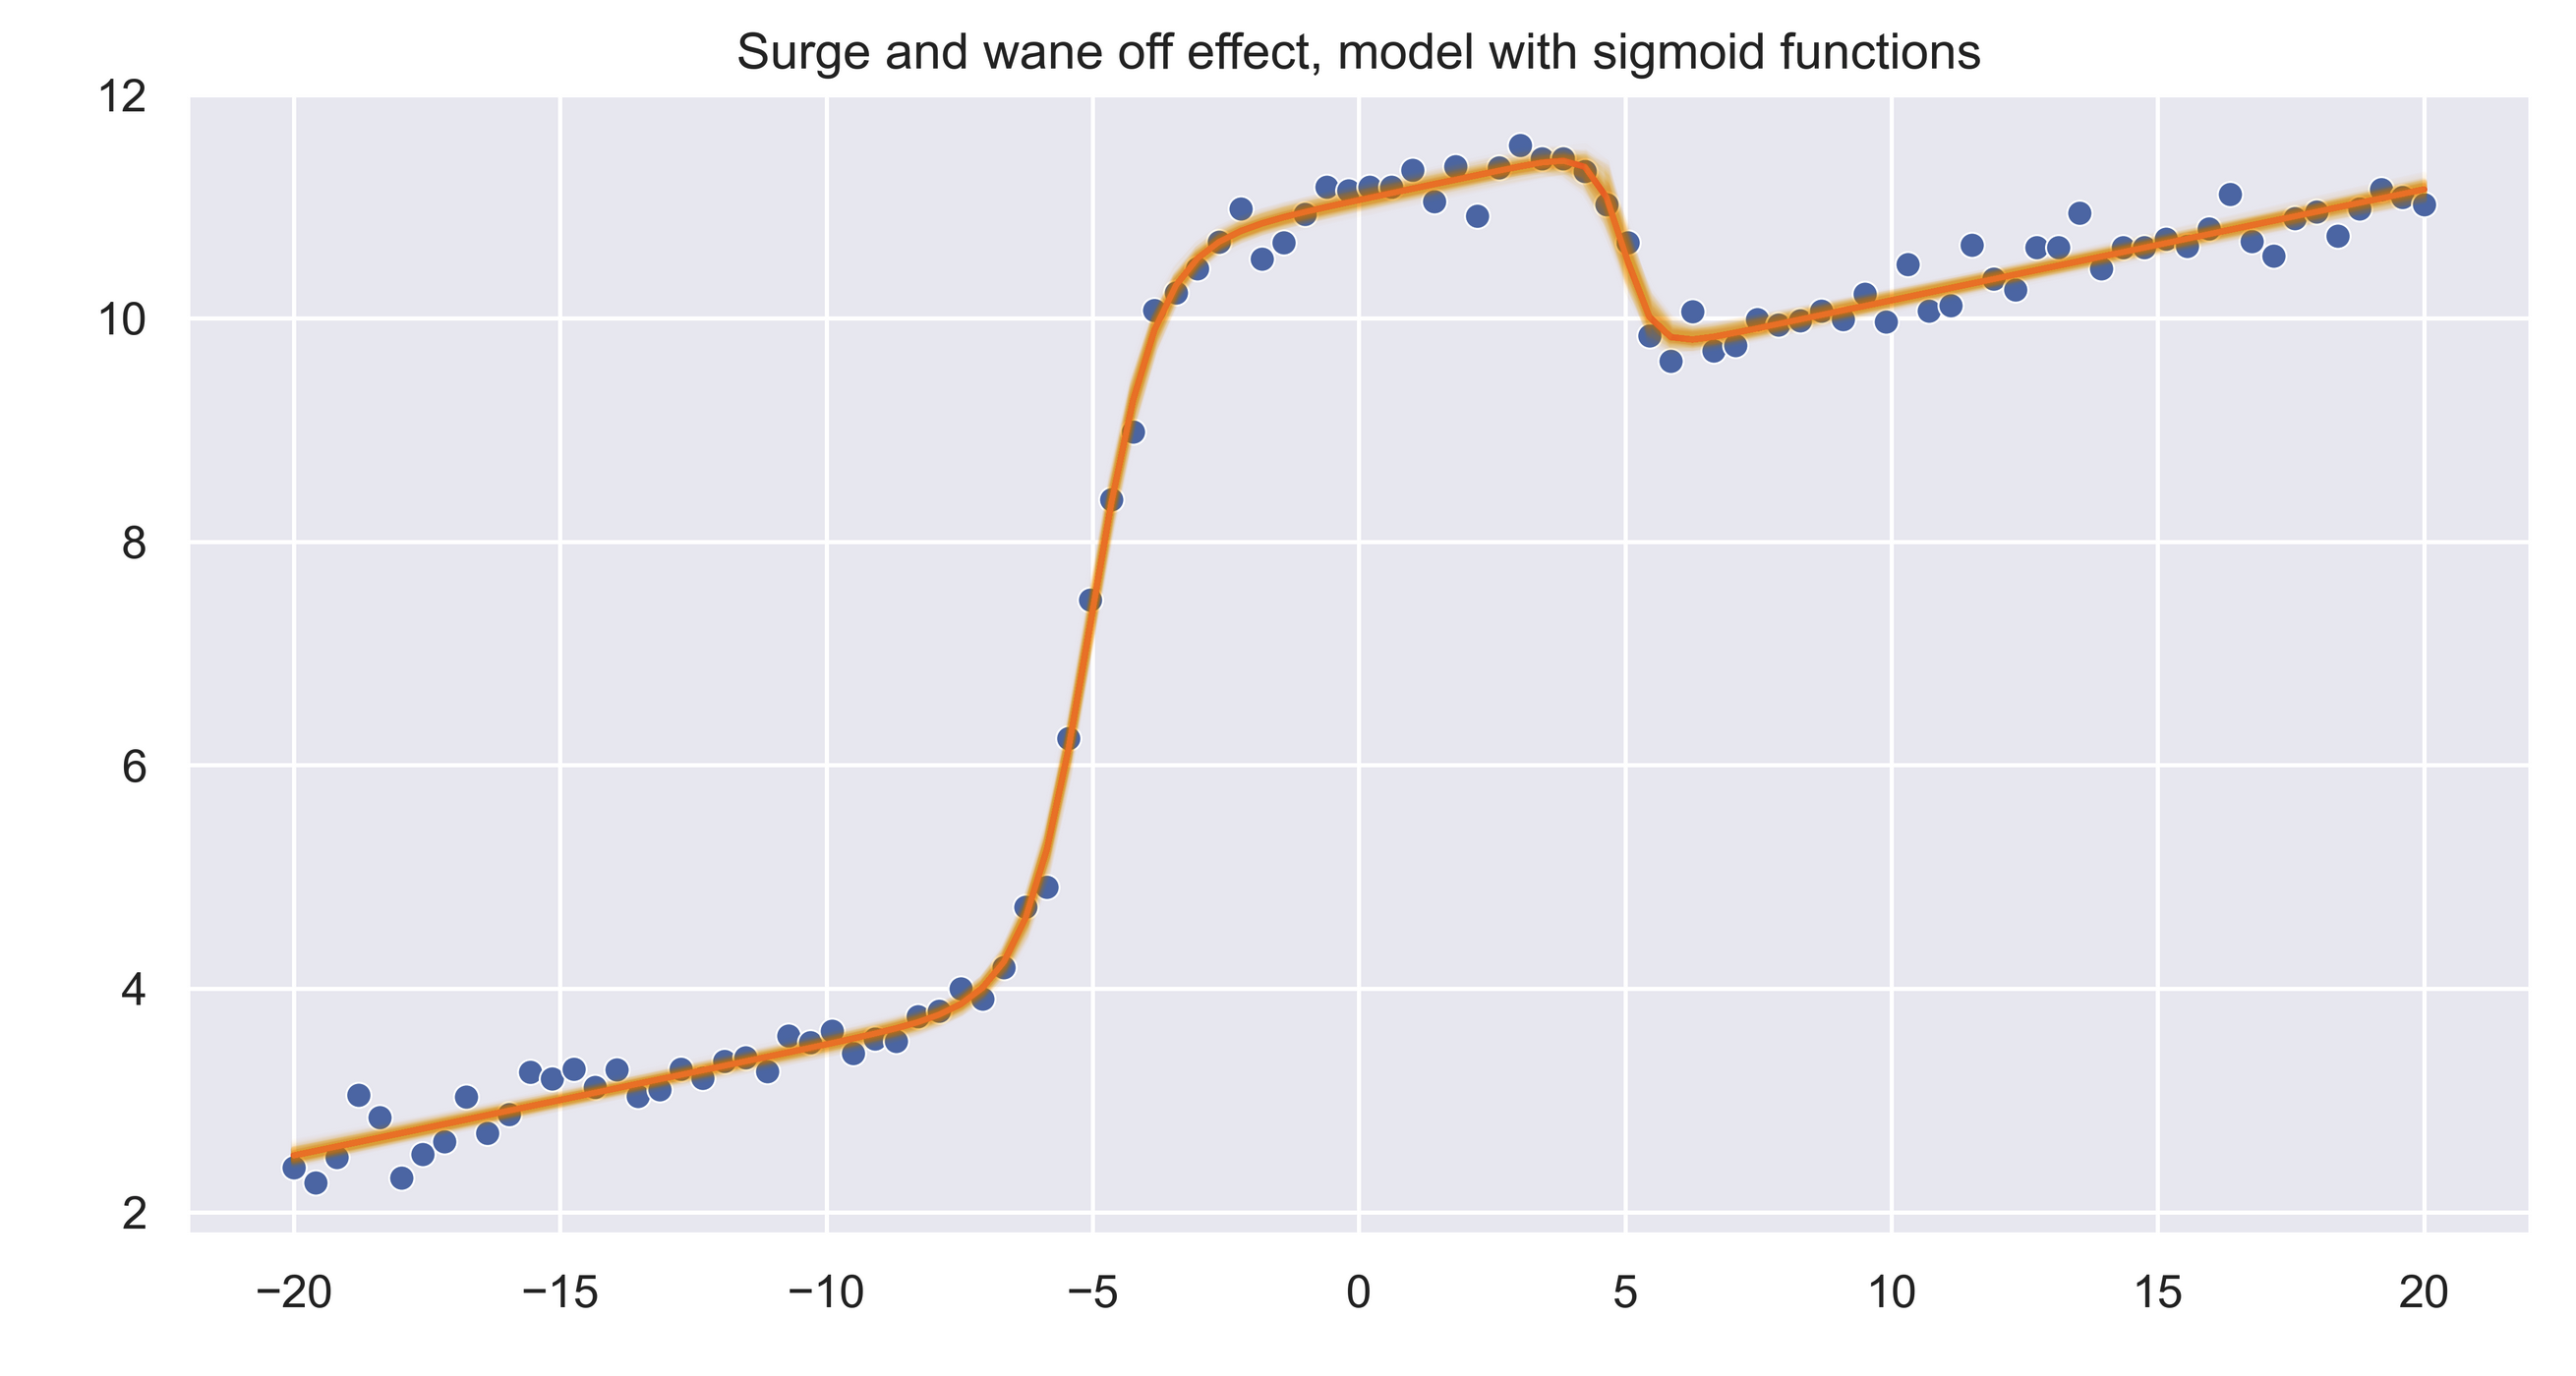
However, application of sigmoids does not only stop at that. In this notebook, I demonstrate that we can use sigmoid to model a gradual change in time series. Parameter of the sigmoid include:
- Location: where the sigmoid turns
- Scale: how much it scales to ( remember, it’s not just to 1)
- Slope: how sudden or gradual the change is.
Then we can later use these parameters to do inference of the effect that we observed in the dataset.
As sigmoids have nice gradients with respect to its parameters, we can apply them to extend classical linear regression, fit them with gradient descent maybe. But I’m not so classical, am I ?
Enter Bayes with the big gun and his associate PyMC3.
This method allows you to build your model in a very clear, concise and flexible way. Let’s say that you have a parametric function with a set of parameters θ that you wish to fit to a dataset. This method allows you to infer not just the MLE estimate of θ, but the distribution of θ as well.
Using the distribution of θ instead of a single point estimate allows us to understand uncertainty of your estimate and make better decision based on that 1
Along with a simple LR, we can now add a sigmoid function to the data and let PyMC3 run its magic and find out the distribution of the function parameter for us.
More than 1 effect ? Just use more sigmoids ;)