
Foolproof A/B test performance sorting
Imagine you have a list of experiments that you need to compare with each other. Your data is a list of trials, with associated success and failures.
Here you have a list of experiments, each is a pair of something like (number_of_trials, number_of_success). How would you sort that list of experiments based on their performance ?
Sorting by n_success - n_failure has the risk of making popular experiments bubble up on top. For example, an experiment of 20 failures out of 100 trials will trump over some experiments with 8 successes out of 10.
Sorting by average rate, which is n_success/n_trials does not take into account the risk of having too little data on some experiments. That sorting scheme will rank experiments with 50 success out of 100 on the same bar with one with 1 success out of 2. The latter has very small sample size, make any estimation with it unreliable.
One solution proposed here uses the lower bound of the Wilson (symmetric) confidence interval, which says: given this trials data, what is , with 95% probability, the estimation larger than? We are trying to estimate the lower bound of the 95% confidence interval of the true average rate.
Using the lower bound instead of the average estimate reduces the risk of overestimating some value that we don’t have a lot of data about. The intuition is that if something we don’t have a lot of data for, we shouldn’t be very optimistic about it.
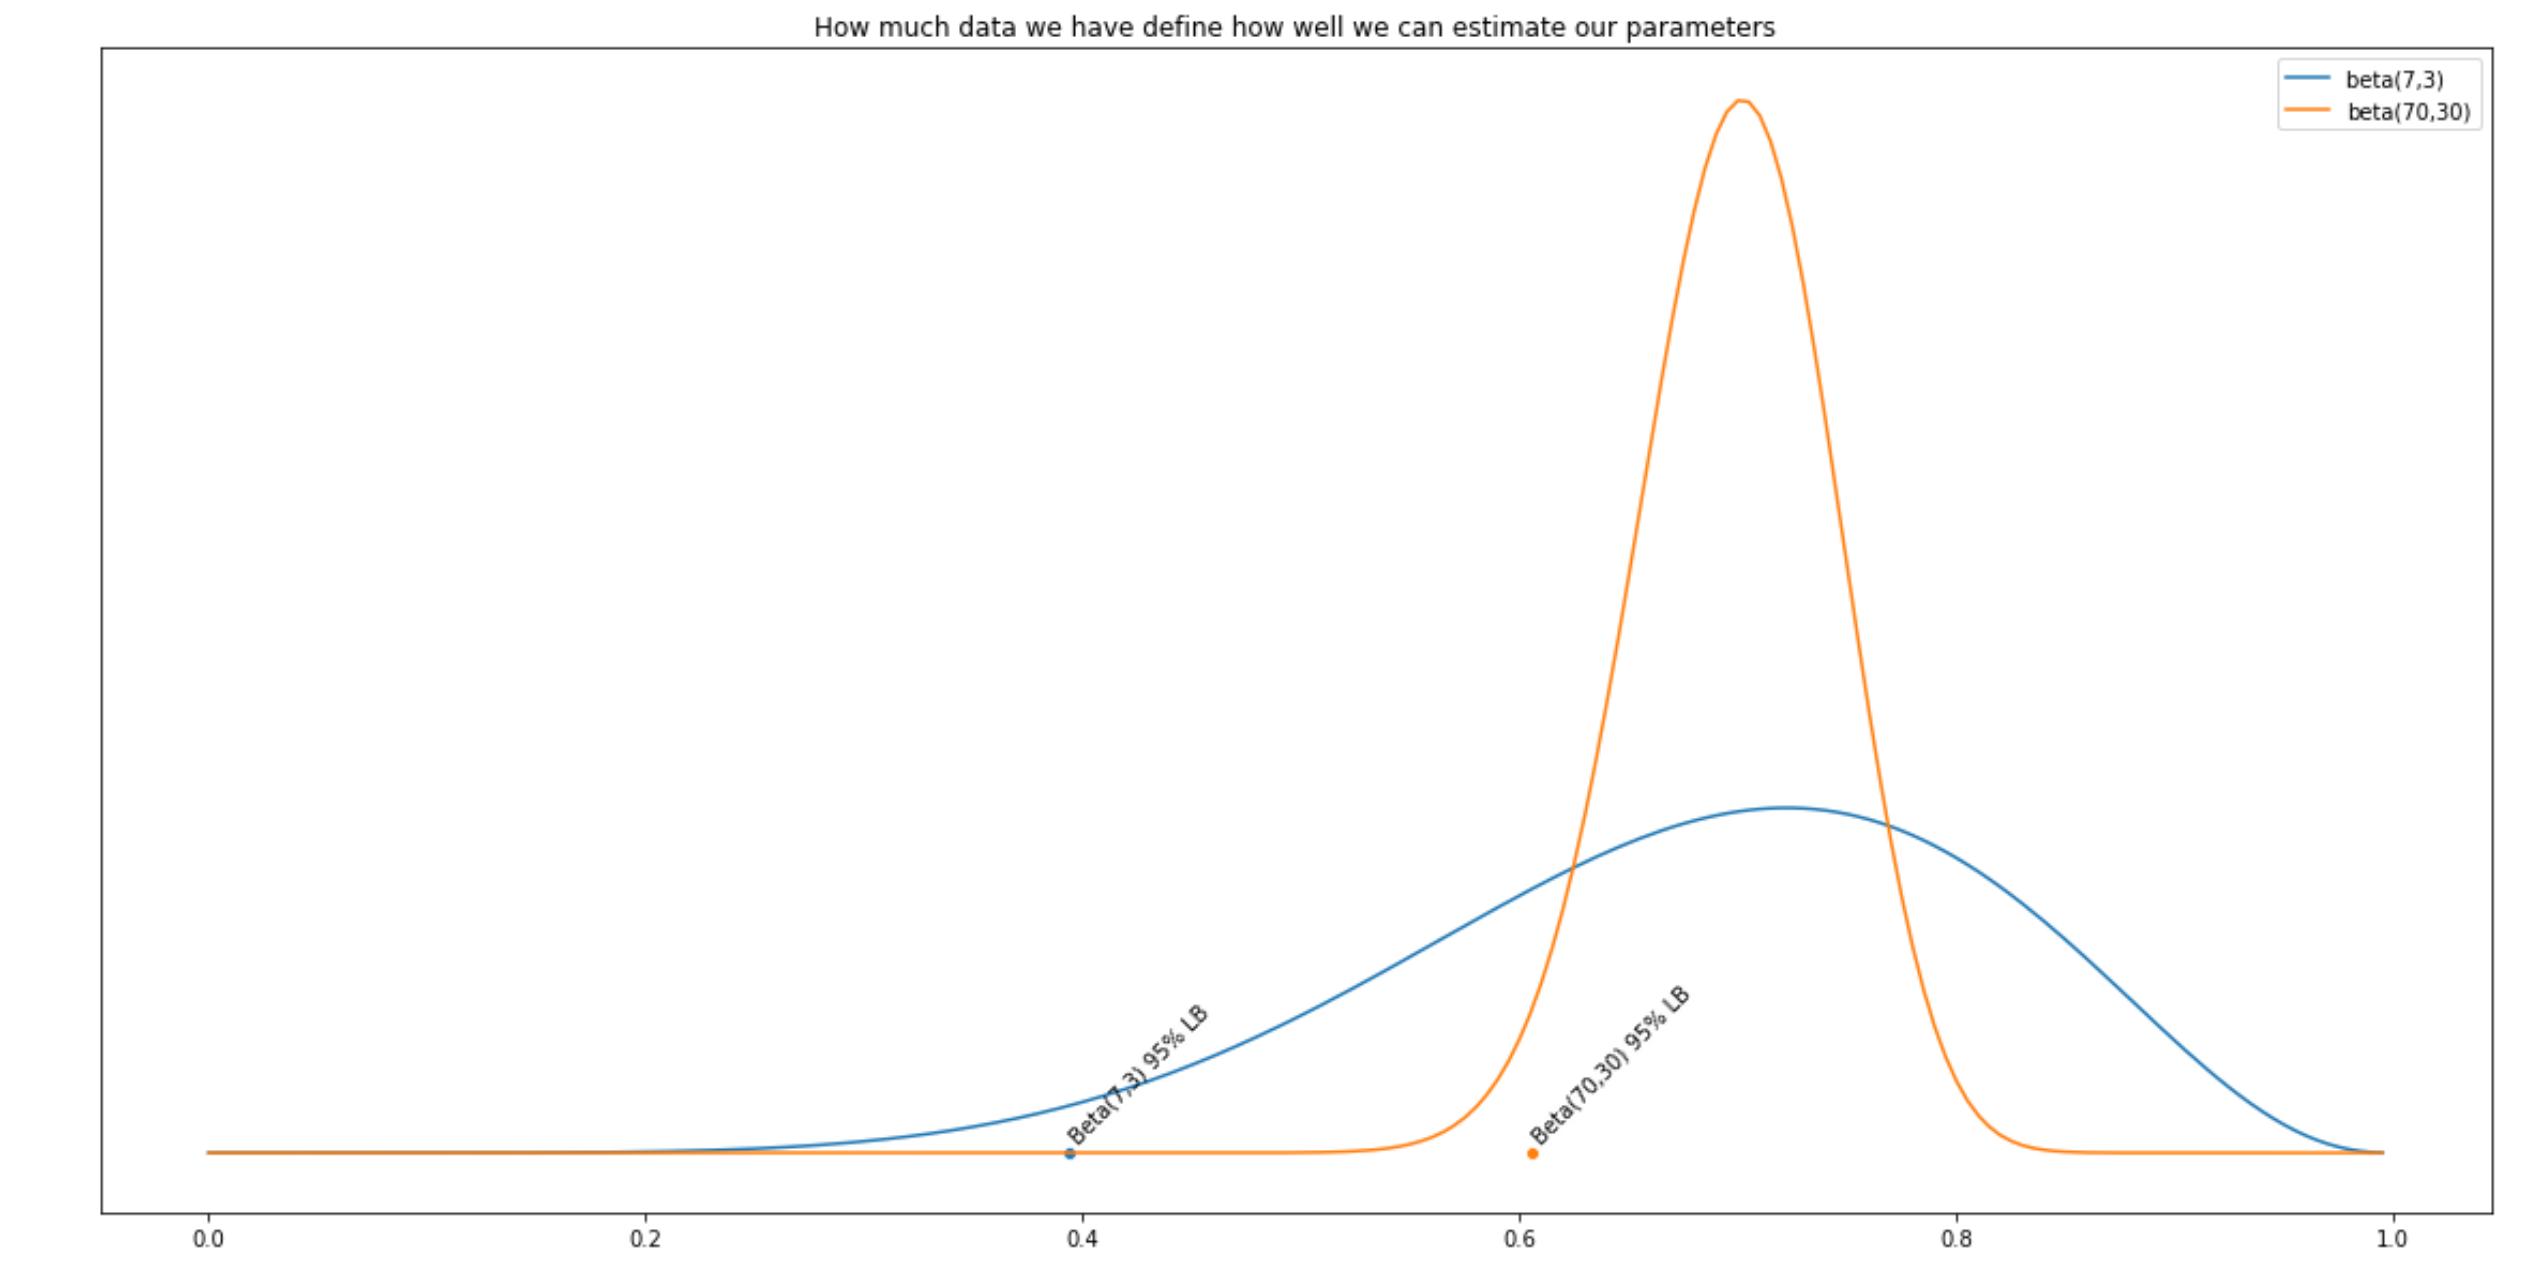
Picture: 2 distributions, same mean, but one varies wilder. Which do you think has a better differentiating power ?
Here I took the idea from Mr. Evan Miller and improve the formula with Jeffrey prior to make Bayesian fan happy.
Foolproof function.